Vahrokh Vain

  • Home ▼
    • Announcements
    • About
  • Games ▼
    • EvE Online – The best space simulation MMORPG
      • EvE Online resources
        • EvE Online tutorials, links, software and resources
        • EvE software reviews
        • EvE downloads
      • Vaerah Vahrokha’s services
        • Services listing
          • Auditing
          • 3rd Party Service, Collateral Holding, Insurance
        • Public Audits Records (PAR)
        • Vahrokh’s Emergencies Relief Trust
        • VAERT thread on the EvE Online forums
        • VEMEX
          • EvE markets auto-cache downloader
        • Companies
      • EvE and real life finance
        • Price Action Trading Course
        • EvEMarketHistoryDump, an EvE markets OHLC data exporter
        • Importing EvE market data in a RL trading platform
        • EvE Online sample trades
        • Best finance books reviews
    • Istaria
    • World Of Warcraft
  • Downloads
  • Technology ▼
    • Computer
      • Tutorials
        • WordPress
          • W3 Total Cache
    • Software
  • Economy and finance ▼
    • CFTC, Forex and general trading disclaimers
    • Price Action Trading Course
    • Market analysis index
    • Best finance books
Vahrokh Vain > Technology > Computer > Games > EvE Online > How to read the in game EvE market charts

How to read the in game EvE market charts

27 December 2011 By Vaerah Vahrokha

How does all this description of trends and RMs help your trading?

RMs are roadblocks on price motion, knowing where they are will help you in several ways.

Let’s look at the previous picture again:
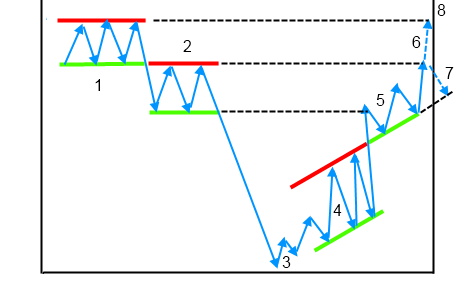
Static and dynamic price levels acting as support and resistanceOnce you read the graph, you may see how the action tends to happen close to those support and resistance lines, not in random space. That is, the market moves randomly but with a meaning. There are elements that help determining possible next moves and avoiding costly mistakes.

After learning the previous chapters, would you decide to buy stock when price is a bit below the top of the RM marked as “2” just because it’s a “dip” below the RM marked as “1”? No, right?

Would you buy where price breaks thru RM marked as “1” before bumping at the base of RM “2”? NO! Nothing tells us that price is not going to do what happens when it breaks thru RM “2” and dives all the way down to “3”.

Would you buy once down at “3”? No, because once again, we have no elements hinting at the market having actually reached the deepest bottom. Once price retraces (a more formal term for “bumping”) on itself past “3” and fails to dive deeper with a new lower low, then we may decide to buy stock.

Buying at the base of dynamic RM “4” would be a safer decision. It seems that demand and supply are keeping it above the dynamic support (unlike for fundamental market analysis we don’t care about why this is happening) and therefore it may be feasible to buy at one of the 3 dynamic RM “4” bottoms.

Is it smart to hold the stock once price climbs to the top of dynamic RM “4” (before piercing the red colored dynamic resistance)? NO! Nothing tells us that price will pierce thru before that event actually happens.

Remember, in trading the most important safeguard is called capital preservation.

It’s always better to let the other traders risk their neck by holding stock at a known resistance line. The trader willing to keep his capital, will sell (potentially causing the downwards motion back inside the RM if his stock is big enough!) at the top and eventually re-purchase the stock once price is above that resistance and has now safely retraced back at the base of dynamic support “5”.

Likewise at “6”: will price break thru the long time resistance and go to 8 or will it bounce back to 7? We cannot know the future, just that something will happen at the “6” “market decision point”. Therefore the safest strategy is to unload at least some of the stock and wait for the market to tell us what it wants to do. The market deserves respect and responsible actions, it punishes trespassers in the most harsh ways.

The trader is not a voodoo practicing wizard, but a very patient person who waits for the market to clearly tell what it wants to do first.

Surely, nothing in trading is foolproof and guaranteed to work, price may decide just to act funny and senseless but with tecniques called “money management” it’s possible to largely offset the inevitable losses and turn up a tidy profit.

~1~

The above tips seem only tailored for longer term traders, are them useless for high frequency traders?

Not at all. Even a cursory analysis of a market may reveal you are about to be fooled by a market manipulation, that your efforts will soon crash into a blocking huge order that acts as unsormountable support and so on.

An expecially useful information is to learn in advance how price just broke support. Now, unlike other traders loaded with stock like you are, you know you are in great danger. As explained in previous chapters, once a support (or resistance) breaks, price moves with great speed until it hits the next underlying roadblock. Your reading of the market may be the factor that lets you dump everything for a small loss instead of looking like one of the many “I have these 3 billions of stock that now have plummetted, I’ll hold them till price turns back up”.

You will have 2.95 billions free to use in another potentially winning market, while the “buy and hold” guys will have 3B locked down for months in a falling market that might never recover back again.

In the next installments we’ll cover some further, advanced information, like: “how to taste the market’s today’s pulse?”. Once again, the concepts will cover both position and high frequency traders.

Related posts:

  1. Price Action, Support and Resistance Trading Course
  2. Fake Yahoo mails off my name
  3. How to import EvE market data in a trading platform
  4. EvE Marketeer – powerful EvE trading oriented website
  5. EvE Online – Nitrogen Isotopes – 2012-01-18 – A very profitable trade
  6. EvE Online – Tritanium – 2012-05-16 – A very profitable trade
  7. EvE Online – Graphs – 2012-05-16 – All minerals, PLEX, Technetium, Nitrogen Isotopes
Pages: 1 2 3 4 5 6 7

Filed Under: Economy and finance, EvE Online, Market mechanics

Advertisment

Comments

  1. Geeky Sayings says

    9 August 2013 at 06:28

    Pretty! This has been a really wonderful article. Thanks for providing this info.

Follow Vahrokh on:

RSS
Facebook
Twitter
YouTube
Follow by Email

Search

Login

  • Lost Password

Topics

  • Announcements (13)
  • Audit (11)
  • Communications (2)
  • Economy and finance (9)
  • EvE audit (11)
  • EvE Online (18)
  • EvE Online (49)
  • EvE public investment record (12)
  • EvE Vahrokh contract (8)
  • EvE Vahrokh investment (6)
  • Featured (9)
  • Games (24)
  • Market analyses (13)
  • Market mechanics (3)
  • Securities (1)
  • Software (5)
  • Trading (22)
  • W3 Total Cache (1)

History

  • January 2025 (1)
  • October 2015 (1)
  • July 2015 (2)
  • February 2015 (1)
  • January 2015 (3)
  • December 2014 (1)
  • August 2014 (1)
  • April 2014 (2)
  • February 2014 (4)
  • December 2013 (1)
  • November 2013 (6)
  • October 2013 (3)
  • September 2013 (1)
  • August 2013 (5)
  • March 2013 (1)
  • February 2013 (1)
  • November 2012 (1)
  • October 2012 (7)
  • August 2012 (2)
  • July 2012 (1)
  • June 2012 (1)
  • May 2012 (4)
  • April 2012 (2)
  • March 2012 (1)
  • February 2012 (10)
  • December 2011 (3)
  • June 2011 (9)
  • May 2011 (7)
  • April 2011 (1)
  • March 2011 (3)
  • February 2011 (7)
  • January 2011 (2)

English Terms of service, legal notice - Contact or request information Privacy

Italiano Richiesta informazioni / contatto - Privacy

Additional copyright notices and credits for the products, media, names and brands featured on this web site

Copyright © 2008–2025 Vahrokh.com - all rights reserved · Log in

Definitioner

1 (OHLC)
Open, High, Low, Close (and sometimes Volume) data, is a finance industry standards format used to represent price evolution during a certain period of time (daily, weekly, hourly...). OHLC data are consumed by financial analysis applications and by charting software to represent price action.
1 (audit)
The general definition of an audit is an evaluation of a person, organization, system, process, enterprise, project or product.
1 (Meta game)
Meta gaming is a broad term usually used to define any strategy, action or method used in a game which transcends a prescribed ruleset, uses external factors to affect the game, or goes beyond the supposed limits or environment set by the game. Another definition refers to the game universe outside of the game itself.
1 (emergent)
Emergent gameplay refers to complex situations in video games, board games, or table top role-playing games that emerge from the interaction of relatively simple game mechanics.
1 (sandbox)
A sandbox game is a type of video game design where a player can roam freely through a virtual world and is given considerable freedom in choosing how or when to approach objectives. Sandbox emphasises a paradigm where, as in a physical sandbox, the user is entertained by his ability to do as they wish creatively and with there being "no right way" of playing the game
1 (discretionary)
A discretionary method is a trading method where little or no mechanical tools and procedures are used to decide the trades. A discretionary trader applies a solid ruleset basing on a flexible interpretation of the market
1 (PLEX)
A Pilot License Extension (PLEX) is an item that adds 30 days of game time to an EvE Online account. It is freely traded like any other in game item. CCP accepts to convert in game PLEXES to real money in case disasters and emergencies happen.
1 (NEISIN)
A New Eden Interstellar Securities Identification Number (NEISIN) uniquely identifies a security. While its structure is identical and strictly compliant with "real life" ISINs, NEISINs are tailored to New Eden investments and contracts.